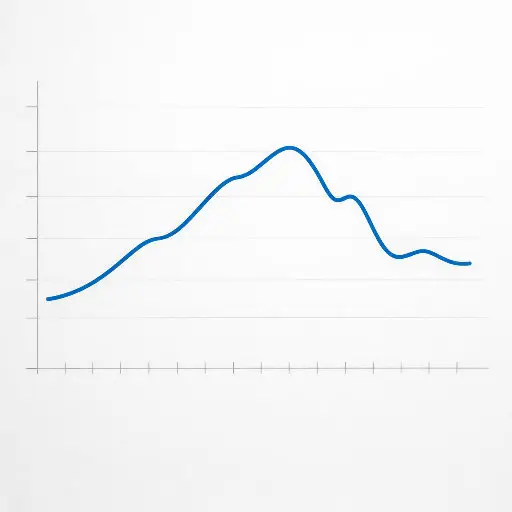
这张图表上的曲线显示了温度随时间的变化。
The curve on this chart displays temperature changes over time.
▼点击显示答案
curve英 /kɜːv/|美 /kərv/
解释
curve 是名词,意思是"曲线",指在图表或平面上呈现弯曲形状的线条。这个词来自拉丁语 curvus(弯曲的),用来描述任何不直的线条或形状。
The curve on this chart displays temperature changes over time.
curve 是名词,意思是"曲线",指在图表或平面上呈现弯曲形状的线条。这个词来自拉丁语 curvus(弯曲的),用来描述任何不直的线条或形状。
在 App 中完整学习这张卡片
在 App 中学习